US Dollar Index in session highs despite U-Mich, near 96.30
- The index keeps intact the firm note above the 96.00 handle.
- US Industrial/Manufacturing Production surprised to the upside.
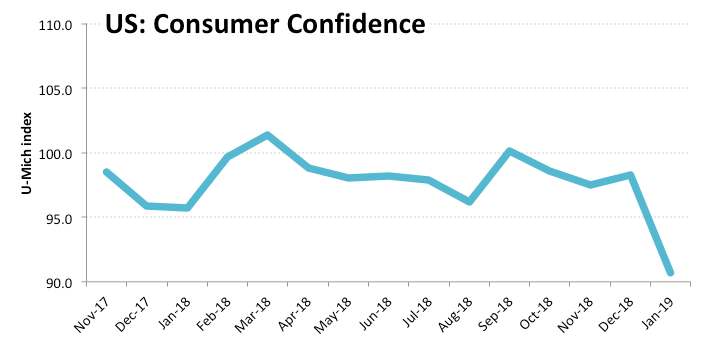
- U-Mich index disappointed at 90.7 for the month of January.
The greenback, in terms of the US Dollar Index, is now adding to earlier gains and is testing once agains the 96.20/30 band in spite of the poor release of the U-Mich index.
US Dollar Index keeps the bid tone
The index managed to clinch fresh tops in the 96.20/25 band following auspicious results from US Industrial Production, Manufacturing Production and Capacity Utilization, all coming in above estimates.
However, the preliminary print of US Consumer Sentiment tracked by the U-Mich index surprised to the downside at 90.7 for the current month.
Earlier in the session, FOMC’s Williams stressed the ongoing shutdown would have implications on Q1 growth, expecting growth to pick up once shutdown is solved. Williams also said that policy on the balance sheet could be reassessed in case conditions change.
What to look for around USD
The ongoing context of marginal volatility and lack of catalysts leaves the scenario unchanged for the greenback in the very near term. That said, the prospects of a ‘no-hike’ by the Federal Reserve this year coupled with speculations of a slowdown in the US economy remain the centre of attention among investors. In addition, the US partial shutdown is entering its fourth consecutive week and could start weighing on sentiment, while cautiousness remains high around the US-China trade talks.
US Dollar Index relevant levels
At the moment, the pair is up 0.16% at 96.23 and a break above 96.26 (high Jan.17) would target 96.60 (55-day SMA) en route to 96.96 (2019 high Jan.2). On the downside, the next support arises at 95.77 (10-day SMA) seconded by 95.03 (2019 low Jan.3) and finally 95.04 (200-day SMA).