GBP/USD Technical Analysis: Cable bears coming back on the forefront post-NFP
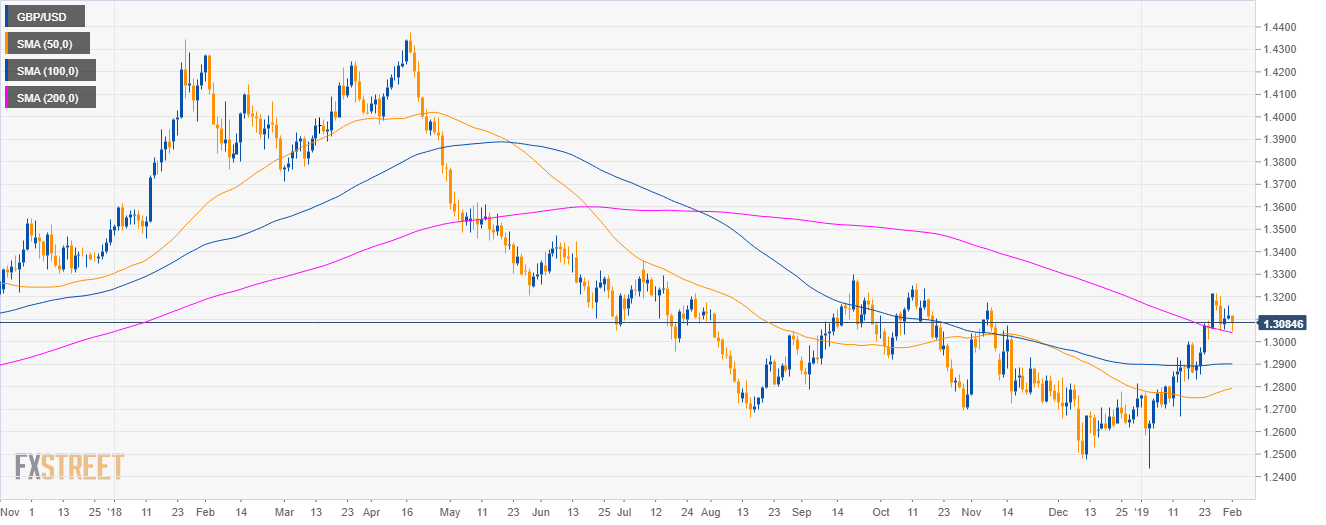
GBP/USD daily chart
- GBP/USD is trading just above its 200-day simple moving average.
- The US nonfarm payrolls (NFP) in January beats expectations with 304K vs. 165K forecast.
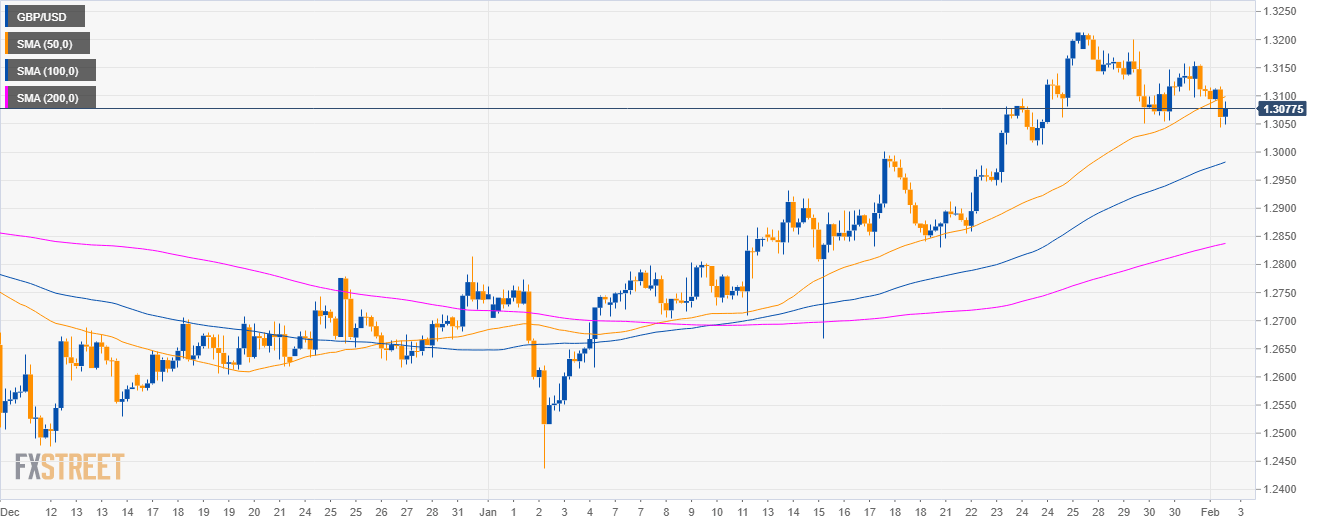
GBP/USD 4-hour chart
- GBP/USD is trading below the 200 SMAs suggesting a bullish bias in the medium-term.
- However, GBP/USD broke below the 50 SMA which indicates that the GBP bulls might be running out steam.
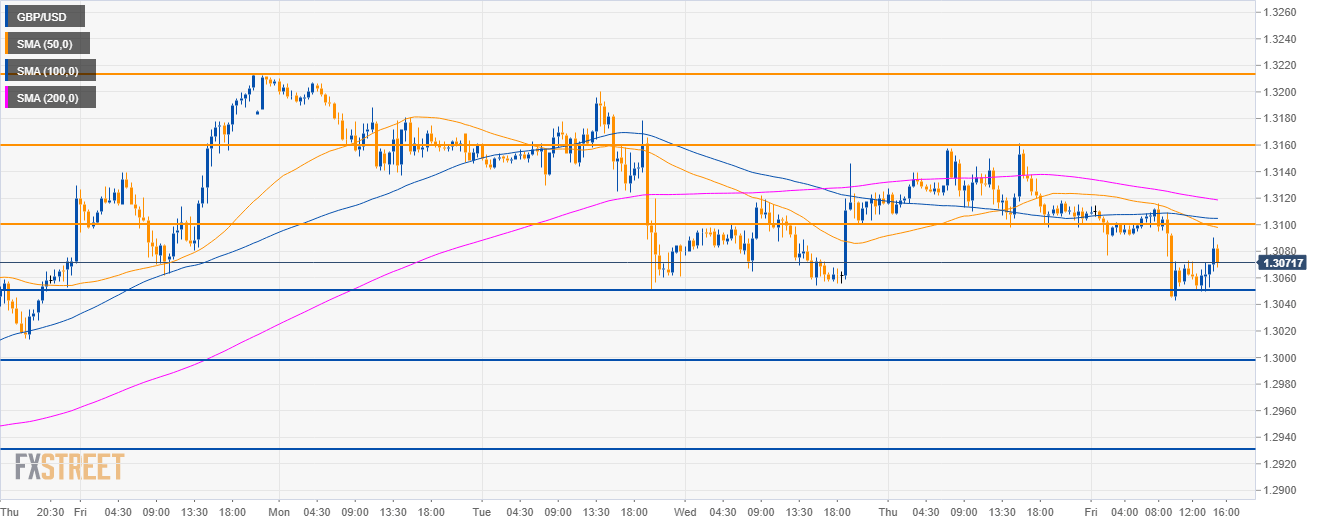
GBP/USD 30-minute chart
- GBP/USD is trading below its main SMAs suggesting bearish bias in the near-term.
- GBP bears will need to break 1.3050 to reach 1.3000 and 1.2930 to the downside.
- GBP/USD bears seem to have retaken control of the market.
Additional key levels
GBP/USD
Overview:
Today Last Price: 1.3075
Today Daily change: -41 pips
Today Daily change %: -0.31%
Today Daily Open: 1.3116
Trends:
Daily SMA20: 1.2938
Daily SMA50: 1.2789
Daily SMA100: 1.2901
Daily SMA200: 1.3046
Levels:
Previous Daily High: 1.3161
Previous Daily Low: 1.3098
Previous Weekly High: 1.3214
Previous Weekly Low: 1.283
Previous Monthly High: 1.3214
Previous Monthly Low: 1.2438
Daily Fibonacci 38.2%: 1.3137
Daily Fibonacci 61.8%: 1.3122
Daily Pivot Point S1: 1.3089
Daily Pivot Point S2: 1.3061
Daily Pivot Point S3: 1.3025
Daily Pivot Point R1: 1.3152
Daily Pivot Point R2: 1.3189
Daily Pivot Point R3: 1.3216