Back
28 Aug 2019
US Dollar Index technical analysis: DXY trading at weekly highs above the 98.22 level
- DXY (US Dollar Index) is gaining steam as the market is about to close the day above the 98.22 resistance.
- The next key resistance can be located near the 98.38 level, crucial previous level.
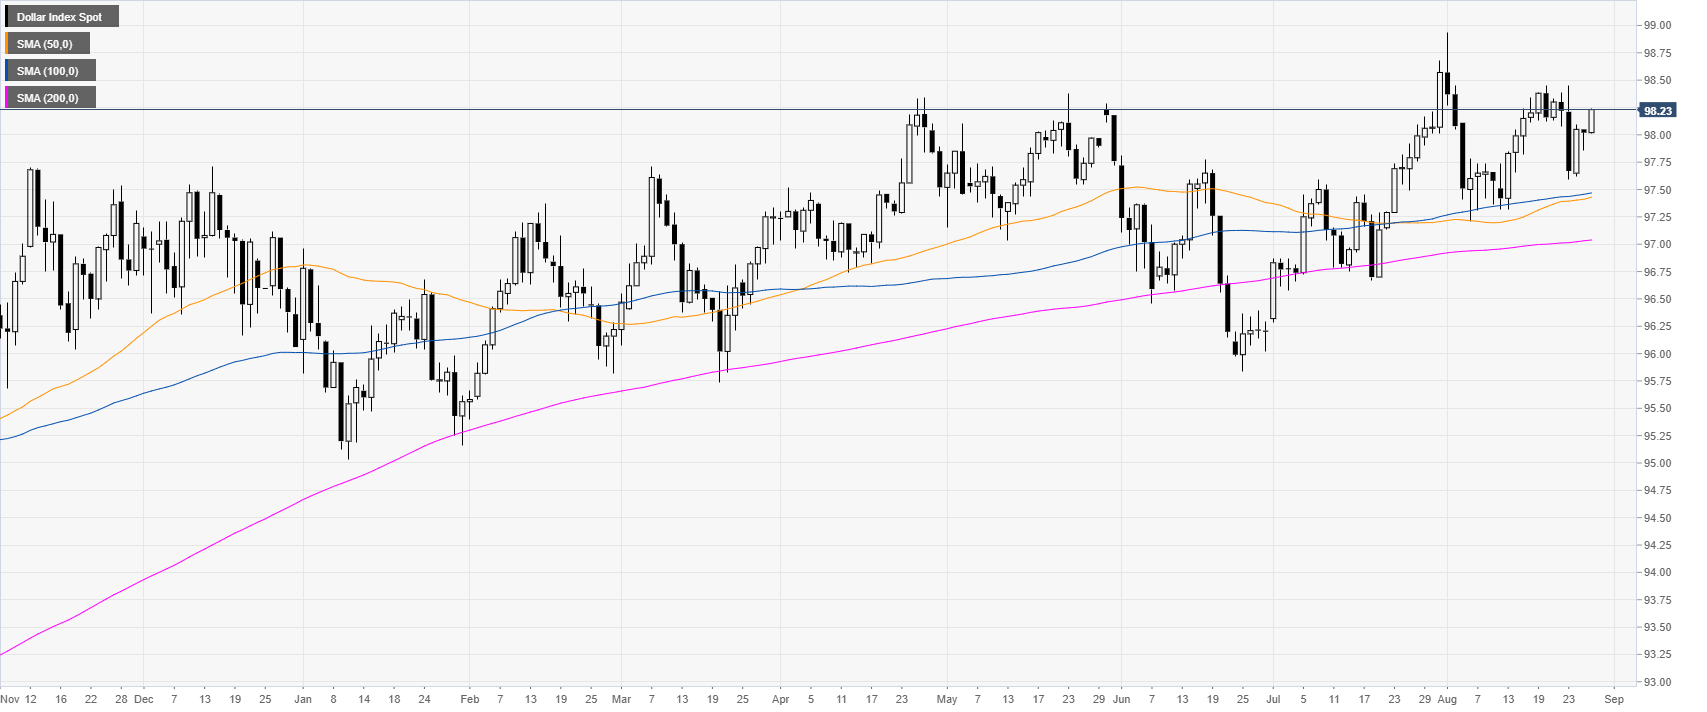
DXY daily chart
DXY (US Dollar Index) is trading in a bull trend above its main daily simple moving averages (DSMAs).
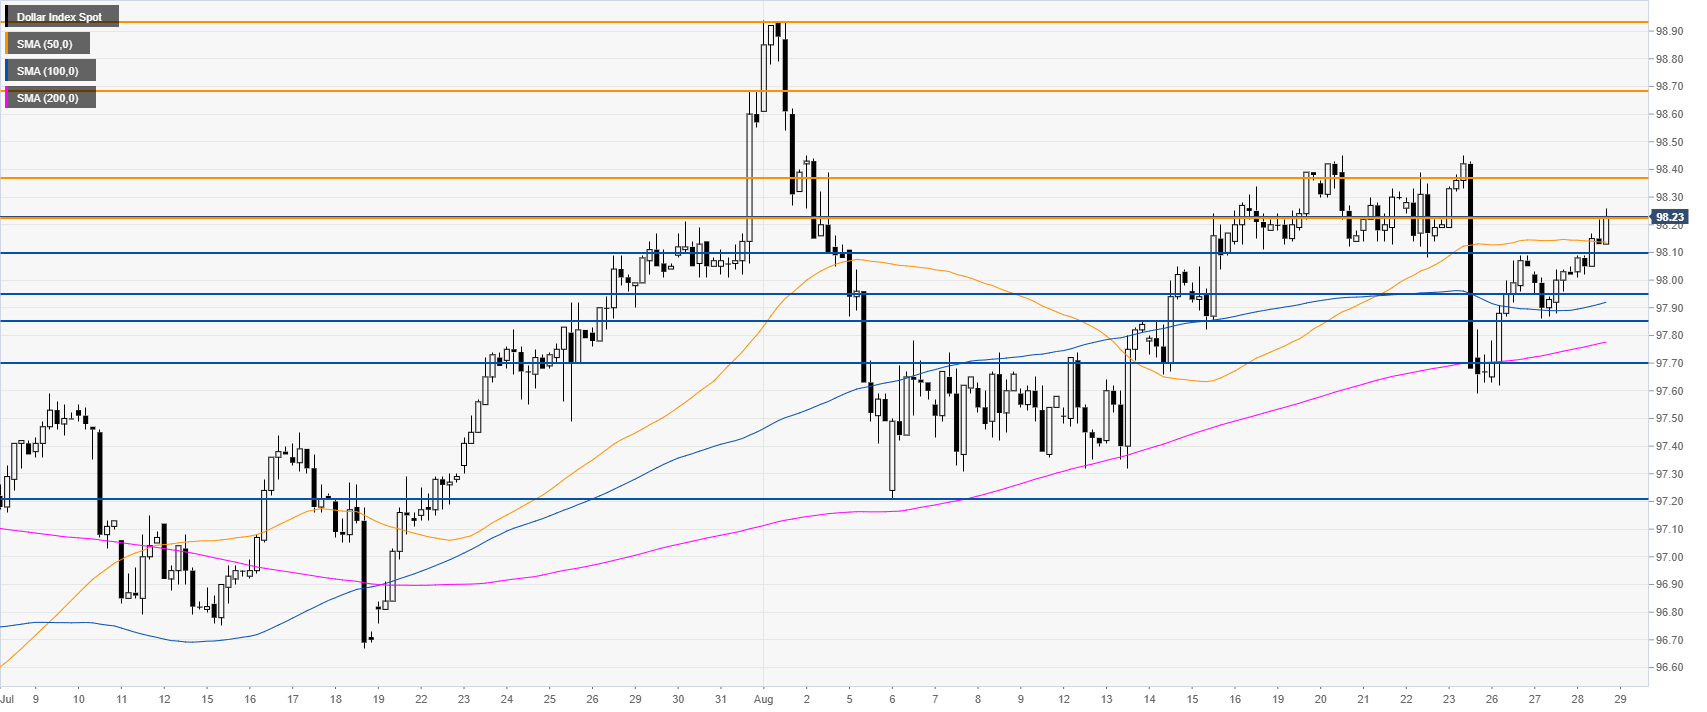
DXY 4-hour chart
This Wednesday DXY broke above the critical resistance at 98.10 opening the doors for a potential continuation up towards 98.36 (previous key level) on the way up. If the market hold above the 98.22 resistance level, it would be seen as a bullish sign.
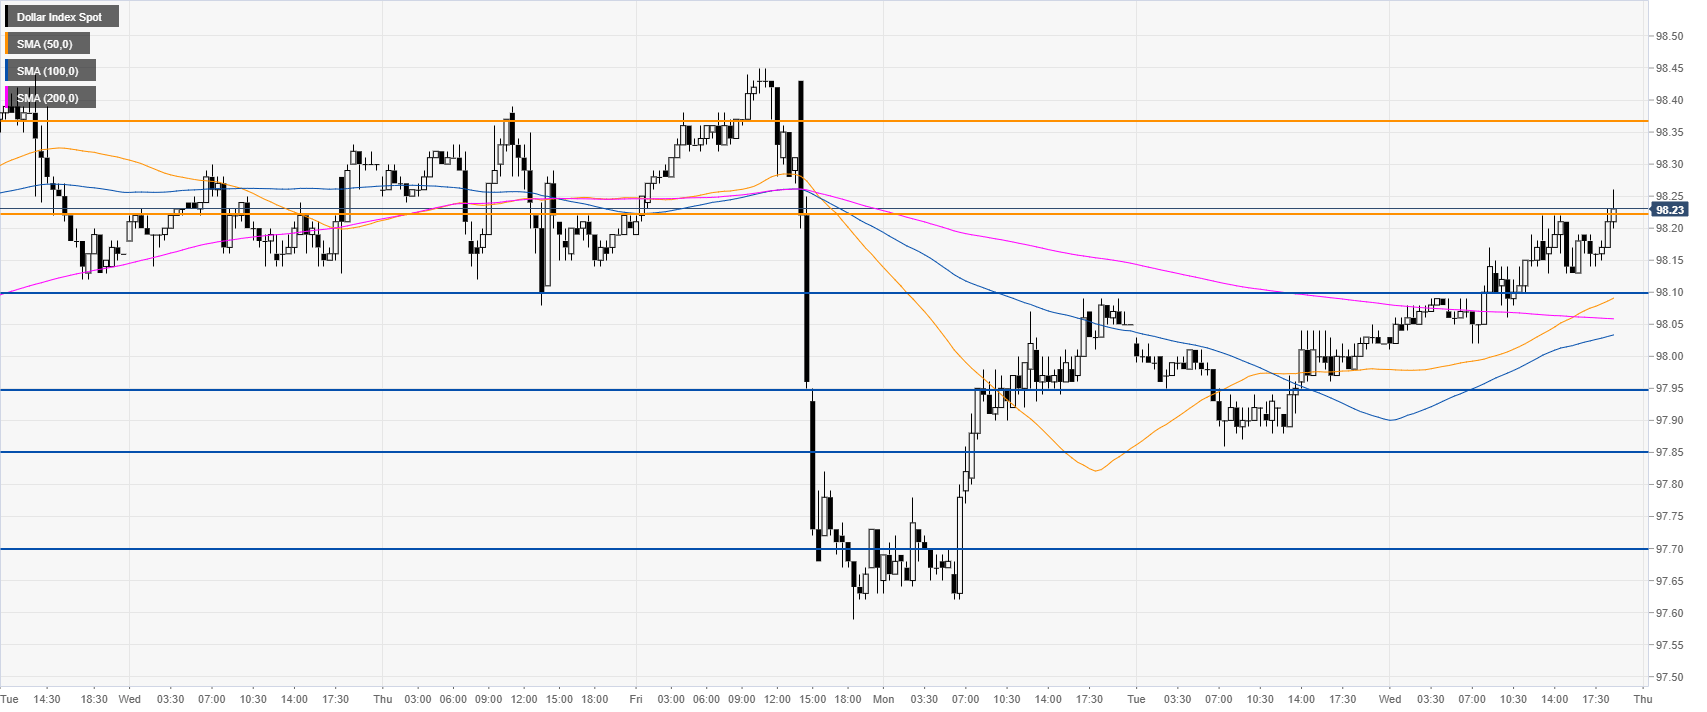
DXY 30-minute chart
The Greenback is trading above the main SMAs, suggesting bullish momentum in the short term. Immediate support is seen at the 98.22 and 98.10 levels.
Additional key levels