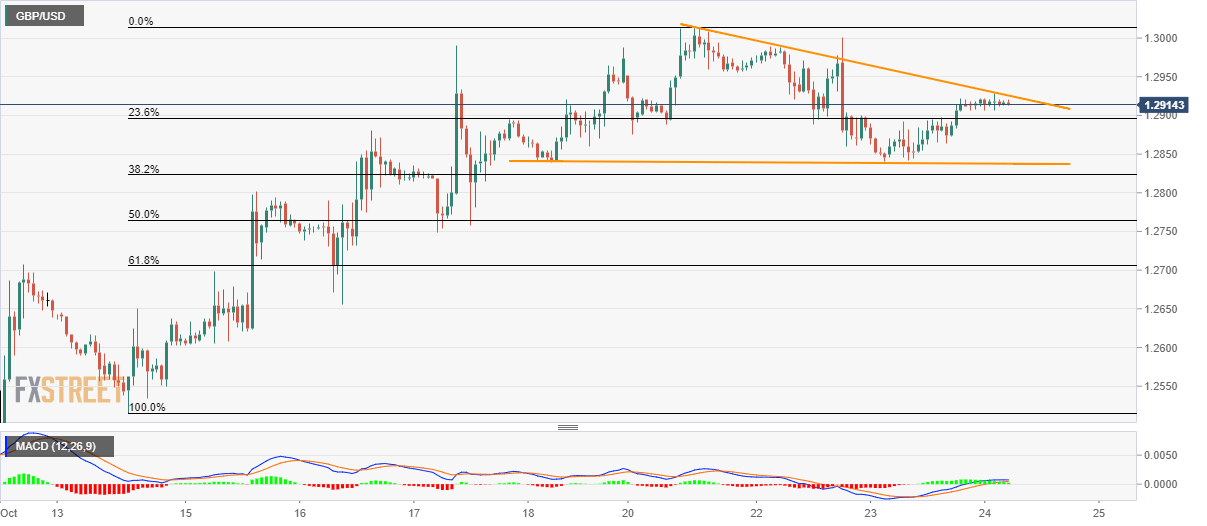
GBP/USD technical analysis: Buyers and sellers jostle around 1.2915/20
- GBP/USD seesaws inside a four-day-old descending triangle.
- Buyers await a break of resistance-line to rely on the bullish MACD.
Ever since the late-trading session in the United States (US), the GBP/USD pair has been trading in a choppy range between 1.2905 and 1.2925 with a four-day-old falling triangle restrict pair’s near-term moves. The quote seesaws near 1.2915/20 by the press time of pre-London open on Thursday.
The pair nears resistance line of the mentioned triangle, around 1.2925, with bullish signals from 12-bar Moving Average Convergence and Divergence (MACD) pushing buyers to anticipate an upside break.
That said, 1.2960 and 1.3015 could immediately please the bulls during the breakout while May highs close to 1.3180 will be on the charts then after.
On the downside, the pattern’s support around 1.2835 could restrict pair’s declines to 1.2750/45 and then to 1.2700 round-figure.
In a case where bears dominate below 1.2700, 1.2650 and 1.2515 will become their favorites.
GBP/USD hourly chart

Trend: sideways
