Back
5 Nov 2019
AUD/USD technical analysis: Aussie trading back near 0.6900 handle ahead of ISM Non-Manufacturing PMI
- The Aussie is reversing parts of its daily gains ahead of US data.
- The level to beat for bulls is the 0.6933 resistance level.
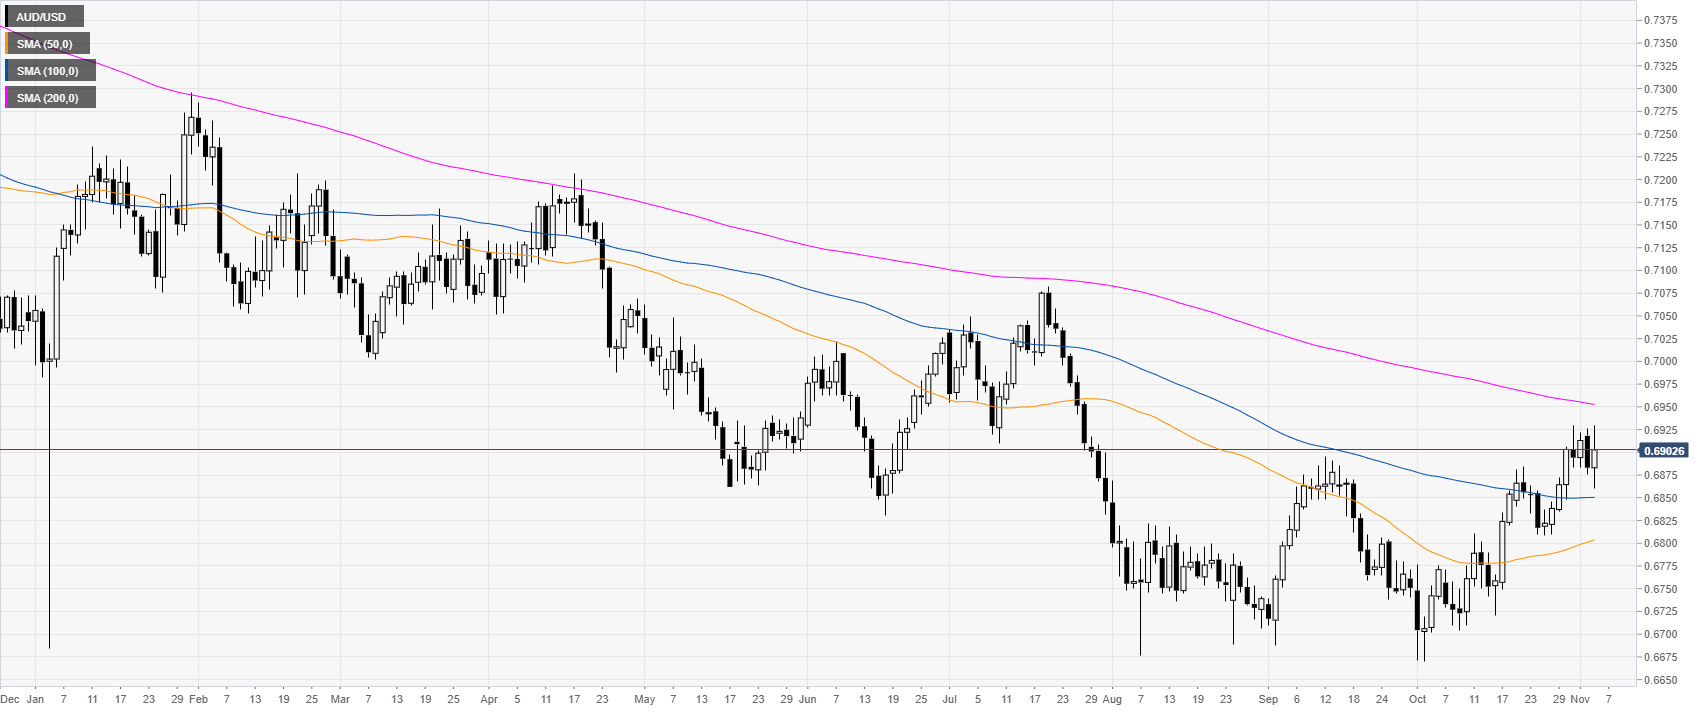
AUD/USD daily chart
The Aussie is trading in a downtrend below its 200-day simple moving average (DMA) on the daily chart. This Tuesday the Aussie is remaining capped below the 0.6925 level. The ISM Non-Manufacturing PMI (Oct) will be watched closely by traders at 15:00 GMT.
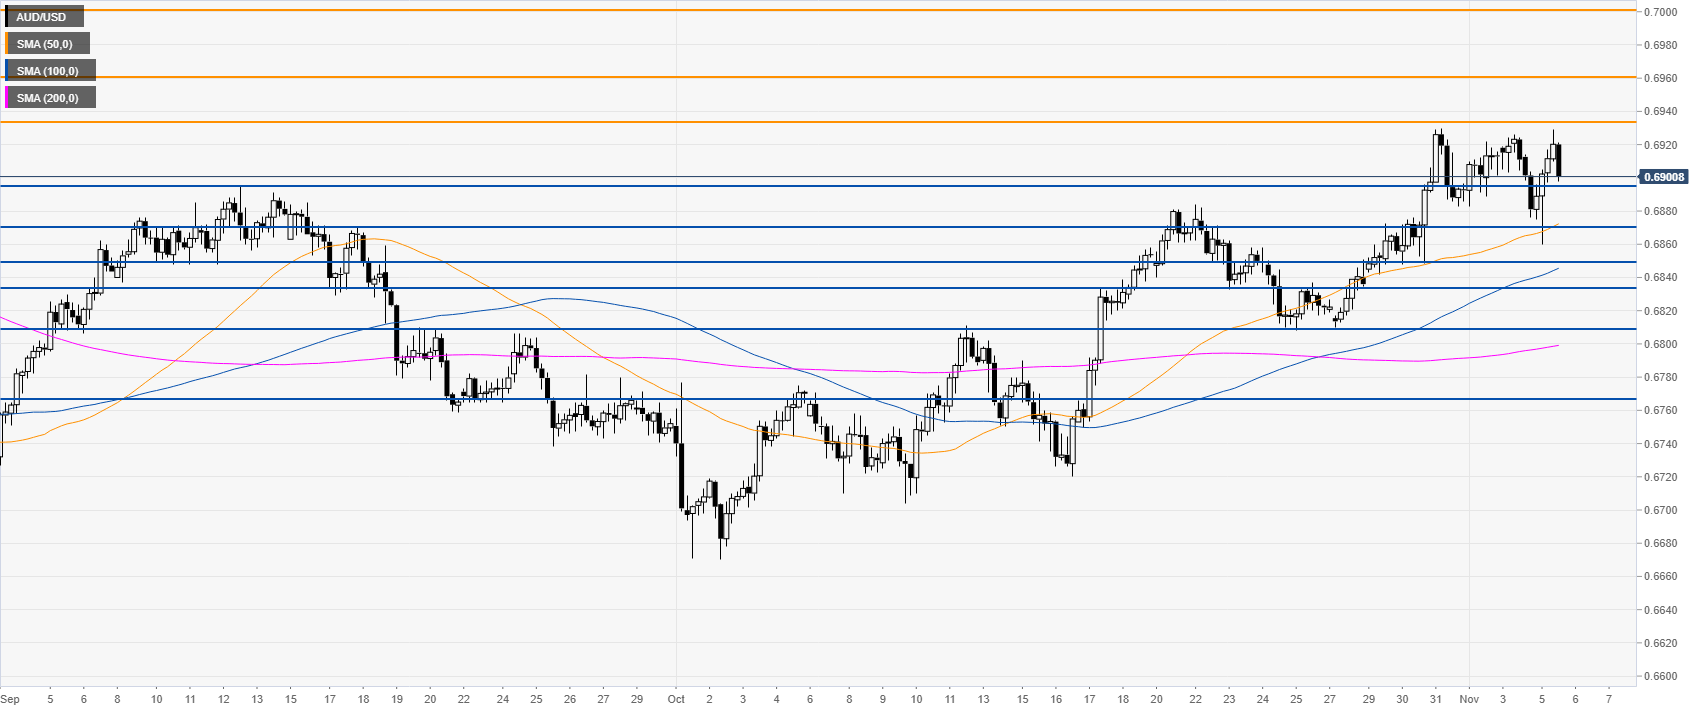
AUD/USD 4-hour chart
The market is trading above the main SMAs, suggesting a bullish bias in the medium term. The level to beat for bulls is at the 0.6933 level followed by 0.6960 and the 0.7000 handle, according to the Technical Confluences Indicator. However, as the Greenback is starting to gain strength across the board, it remains to been seen how far can bulls push the market in the medium term.
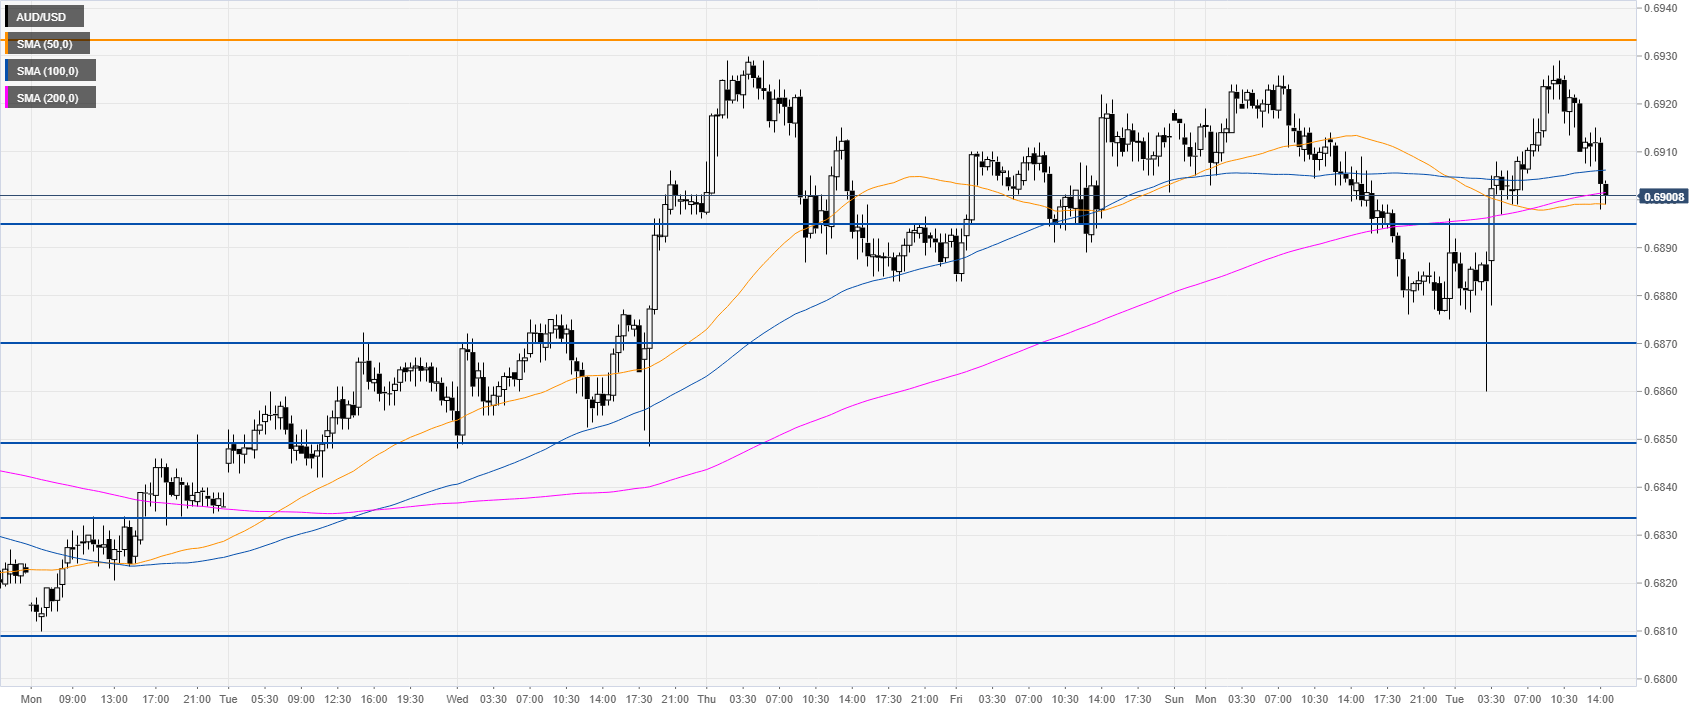
AUD/USD 30-minute chart
The spot is reversing part of the earlier gains, trading back to the 0.6900 handle. Further consolidation is likely. Support is seen at 0.6895, 0.6870 and 0.6850 price level. A daily close below the 0.6850 might lead to a significant slowdown in the bull trend.
Additional key levels.