Back
3 Dec 2019
Gold Technical Analysis: Yellow metal breaks to the upside, trades near $1475/oz
- The yellow metal is rising sharply in the New York session.
- The key resistance to watch is the 1480 level.
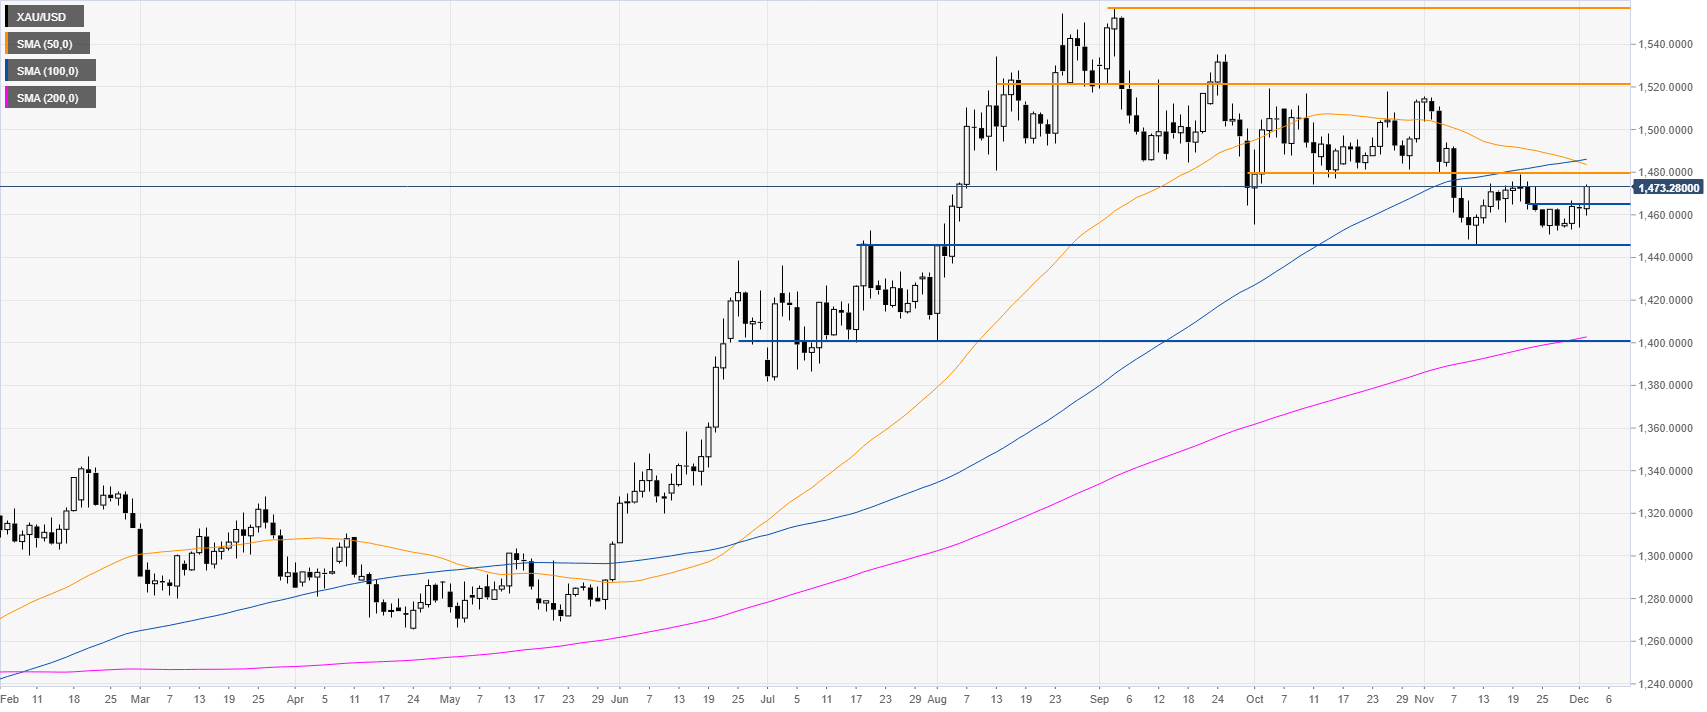
Gold daily chart
Gold is rebounding from the November lows and broke the 1465 resistance level while trading below the 50/100-day simple moving averages (SMAs).
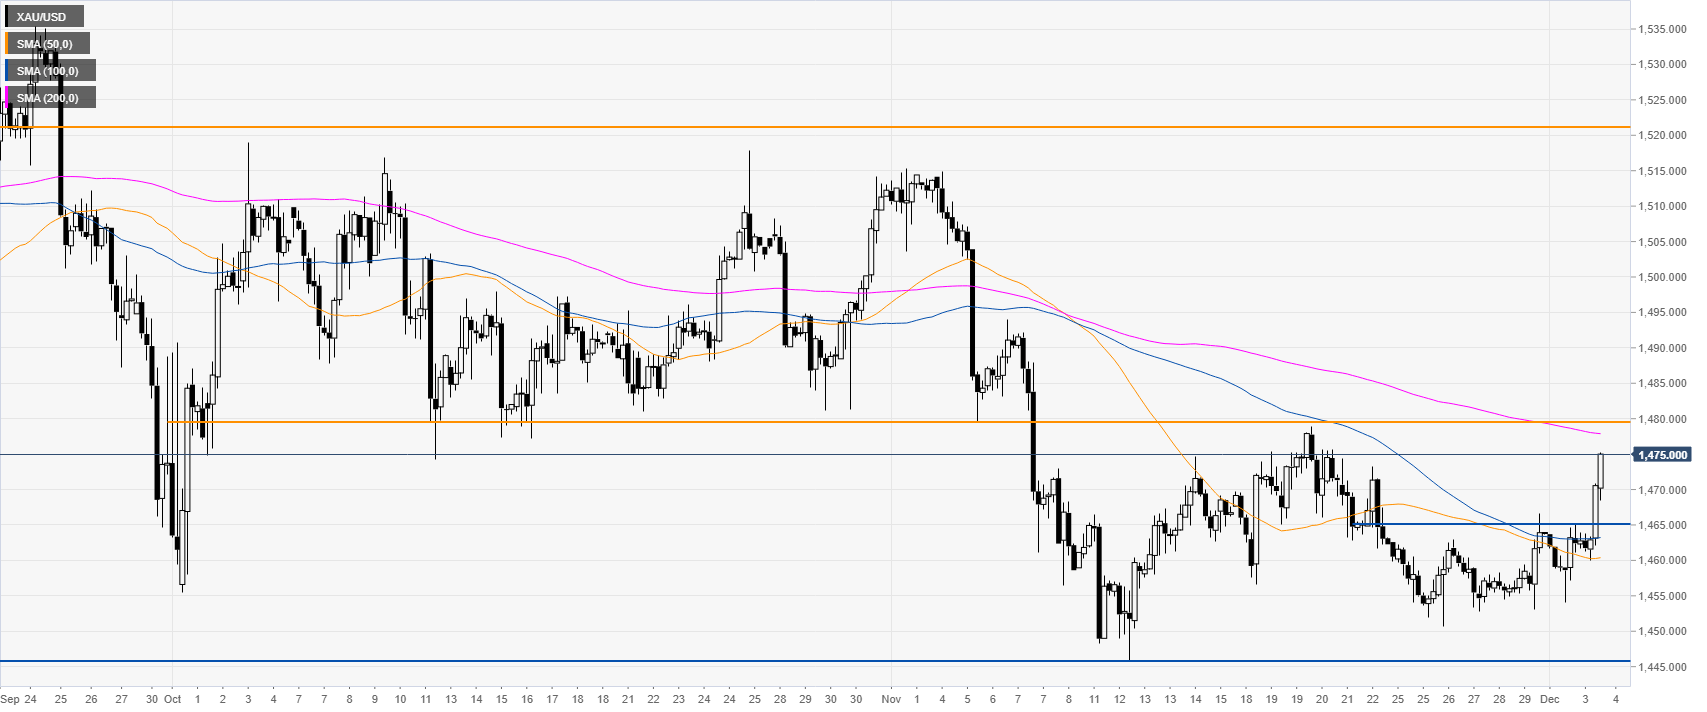
Gold four-hour chart
The metal left the 50 and 100 SMAs behind and seems headed towards the 1480 resistance near the 200 SMA. The 1465 level is becoming support.
Additional key levels