EUR/USD has one more resistance line before it can advance more quickly – Confluence Detector
EUR/USD has been rising moderately but seems hesitant ahead of the Non-Farm Payrolls. What's next?
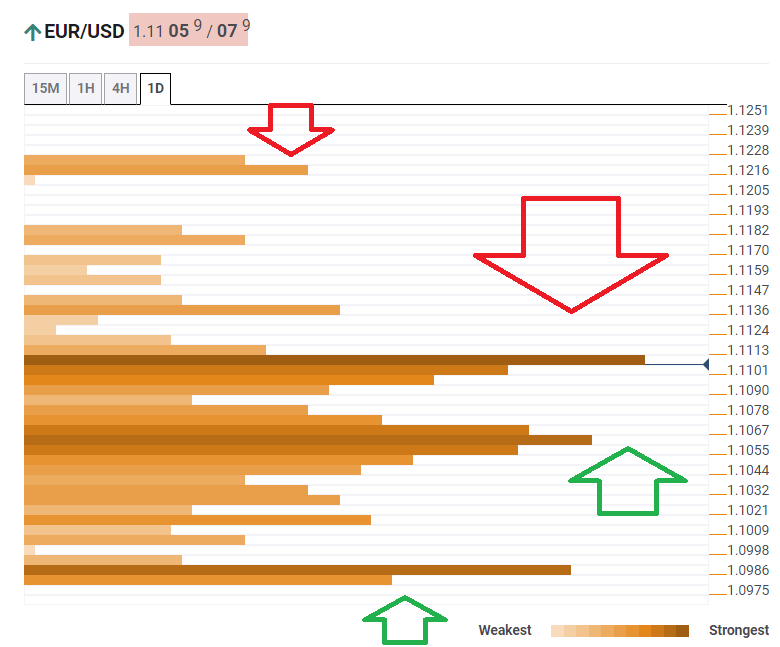
The Technical Confluences Indicator is showing that euro/dollar faces fierce resistance at 1.1107, which is a dense cluster of lines including the Fibonacci 61.8% one-month, the Bollinger Band 15min-Lower, the BB 4h-Upper, the Simple Moving Average 50-15m, the SMA 10-1h, the BB 15min-Middle, and the BB one-day Upper.
If the pair manages to break higher, EUR/USD may shoot higher and has only minor hurdles on its way to 1.1216. That line is where the previous yearly low meets the price.
Support awaits at 1.1061, which is the confluence of the Fibonacci 38.2% one-month, the Pivot Point one-day Support 2, the PP 1w-R2, the BB 4h-Lower, the Fibonacci 38.2% one-month, the SMA 50-one-day, the Fibonacci 161.8% one-day, the PP one-day S2, the PP one-week R2, and more.
Further down, the next support line is at 1.0986, which is the meeting point of the previous monthly low and the previous weekly low.
Here is how it looks on the tool:
Confluence Detector
The Confluence Detector finds exciting opportunities using Technical Confluences. The TC is a tool to locate and point out those price levels where there is a congestion of indicators, moving averages, Fibonacci levels, Pivot Points, etc. Knowing where these congestion points are located is very useful for the trader, and can be used as a basis for different strategies.
This tool assigns a certain amount of “weight” to each indicator, and this “weight” can influence adjacents price levels. These weightings mean that one price level without any indicator or moving average but under the influence of two “strongly weighted” levels accumulate more resistance than their neighbors. In these cases, the tool signals resistance in apparently empty areas.
Learn more about Technical Confluence