US Dollar Index Technical Analysis: Probes four-day losing streak
- DXY benefits from oversold RSI, still stays below the previous support trend line.
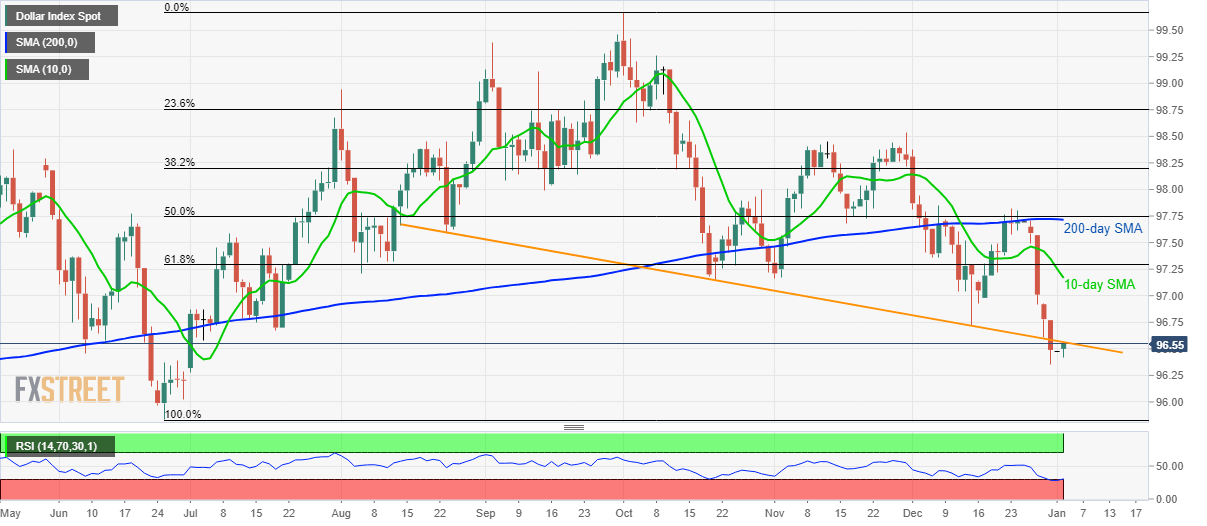
- June month low acts as the key support whereas 61.8% Fibonacci retracement adds to the resistance.
US Dollar Index (DXY) bounces off six-month low while taking the bids to 96.53 amid the pre-European session on Thursday. In doing so, the quote confronts a descending trend line stretched since mid-August (previous support). Also supporting the gauge’s U-turn are oversold conditions of 14-day RSI.
However, buyers will wait for a daily closing beyond 96.56, comprising the support-turned-resistance, before targeting mid-December low near 97.00.
Though, 10-day SMA and 61.8% Fibonacci retracement of June-October advances, around 97.15 and 97.30 respectively, will limit the further upside of the greenback index.
Meanwhile, the recent low near 96.35 and June month bottom surrounding 95.80 are likely adjacent supports that can restrict short-term declines of the US dollar’s barometer.
DXY daily chart
Trend: Bearish