USD/IDR Price Analysis: Indonesian rupiah sellers pierce monthly resistance line
- USD/IDR prints five-day winning streak while taking the bids around 14,800.
- Bullish MACD suggests further upside of the pair, a sustained of the trend line becomes necessary.
- 200-day EMA acts as the strong downside support.
USD/IDR extends its north-run to 14,797, up 0.50% on a day, during the pre-European session on Friday. The quote crosses an upward sloping trend line from June 12 to print the new high since May 29.
While bullish MACD favors the buyers, overbought RSI conditions push them to wait for a daily closing beyond the immediate resistance line, at 14,802 now, before attacking the 15,000 threshold.
Other than the 15,000 round-figures, the late-May top near 15,020 will also add filters during the quote’s run-up, a break of which could propel the quote towards May month’s high near 15,470.
On the downside, the pair’s break of 200-day EMA, currently around 14,540, will recall the bears targeting the monthly low near 14,225.
Should there be a further consolidation of earlier upside past-14,225, 14,000 psychological magnet and June month’s low near 13,850 may return to the charts.
USD/IDR daily chart
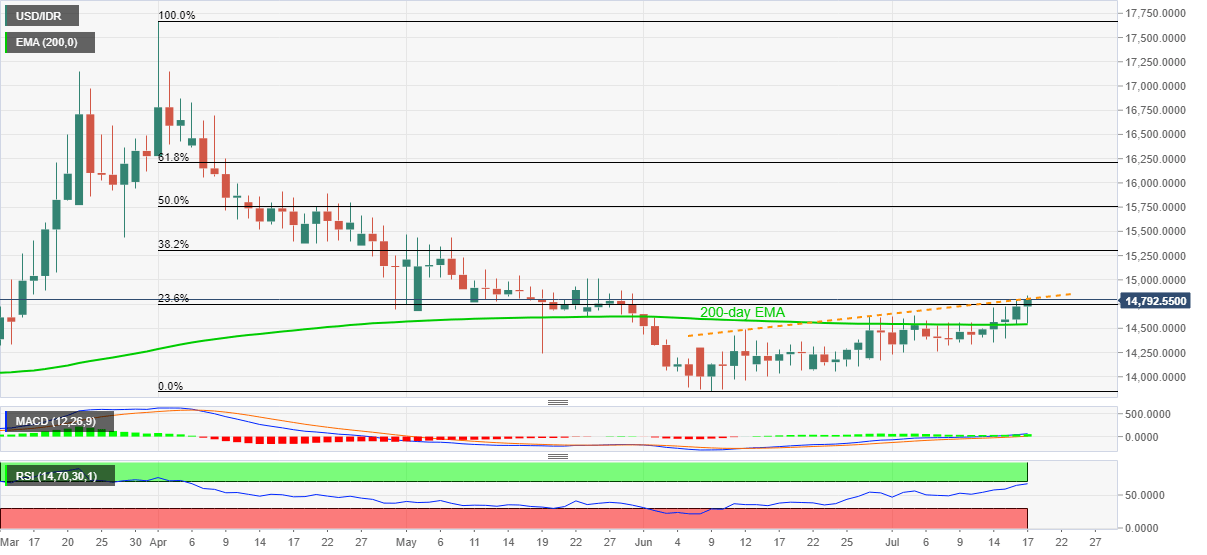
Trend: Bullish