EUR/USD Price Analysis: Probes Friday’s high, bullish breakout on weekly chart
- EUR/USD has printed its first weekly close above key average in over a year.
- The breakout looks to have opened the doors for 1.15.
EUR/USD is better bid near 1.1433 at press time, having proved Friday’s high of 1.1444 a few minutes ago. The 10-pip range of 1.1440 to 1.1450 has proved to be a tough nut to crack since July 15.
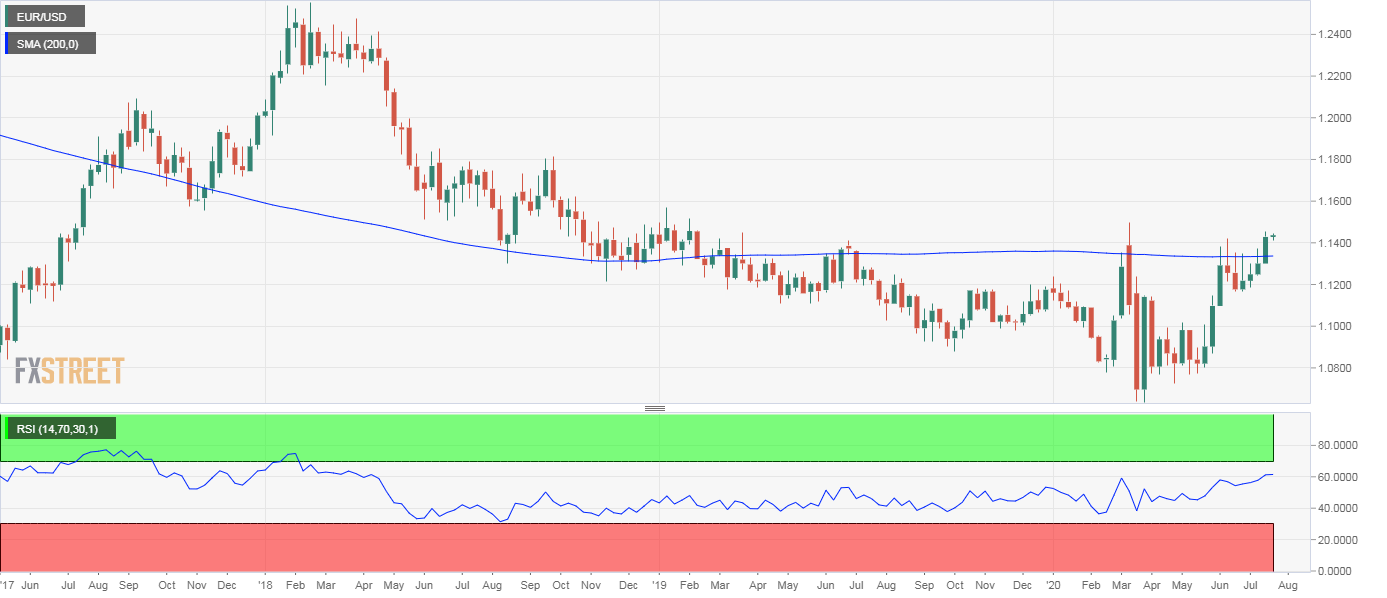
Technicals are aligned in favor of a convincing move above that resistance range. To start with, the weekly chart shows a bullish breakout above the 200-week simple moving average (SMA) – the first since the end of February 2019.
The bulls repeatedly failed to force a convincing weekly close above the key hurdle in the preceding six weeks. As such, stronger buying pressure may now emerge, more so, as the 14-week relative strength index is reporting the strongest bullish bias since April 2018. In addition, the 14-day RSI is also reporting bullish conditions with an above-50 print.
The pair looks set to test and possibly break above 1.15 in the near-term. The bullish bias would be invalidated if the pair finds acceptance under the previous week’s low of 1.1296.
Weekly chart
Trend: Bullish