AUD/USD Price Analysis: Mildly offered around 0.7350 inside short-term EMA envelope
- AUD/USD holds lower ground inside weekly trading range.
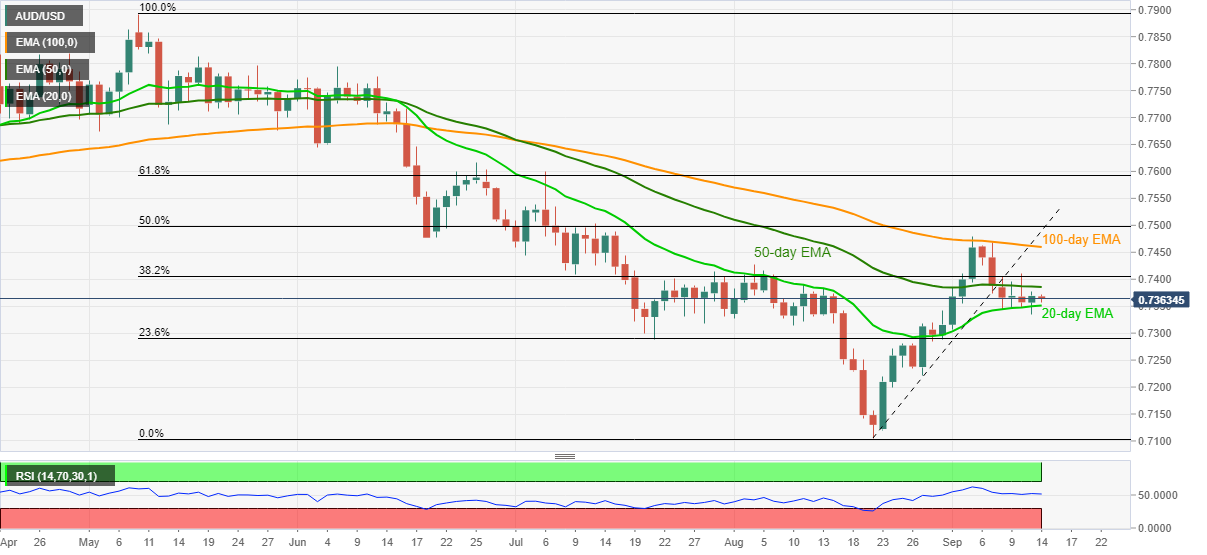
- 20-day, 50-day EMA restricts immediate moves, 100-day EMA adds to the upside filters.
- Steady RSI suggests further grinding but a three-week-old trend line break keeps sellers hopeful.
AUD/USD remains on the back foot around 0.7360, down 0.09% intraday, during early Tuesday.
The Aussie pair dropped to the September-start lows the previous day before bouncing off 0.7355. In doing so, the quote keeps the short-term trading range between 20-day and 50-day EMA.
In addition to the 20-day and 50-day EMA levels, respectively around 0.7385 and 0.7350, steady RSI conditions also signal a lack of momentum.
However, the pair’s sustained trading below 100-day EMA, around 0.7460 by the press time, as well as the last week’s downside break of an ascending trend lien from August 20, keeps the AUD/USD sellers hopeful.
Hence, sellers await a downside break of the 20-day EMA level of 0.7350 to aim for 23.6% Fibonacci retracement of the May-August downside, near 0.7290.
Following that, 0.7230 and 0.7160 may challenge AUD/USD bears before directing them to the yearly low near 0.7130.
AUD/USD: Daily chart
Trend: Further weakness expected