Silver Price Forecast: XAG/USD struggles at $25.00, steady around $24.50 as bulls take a breather
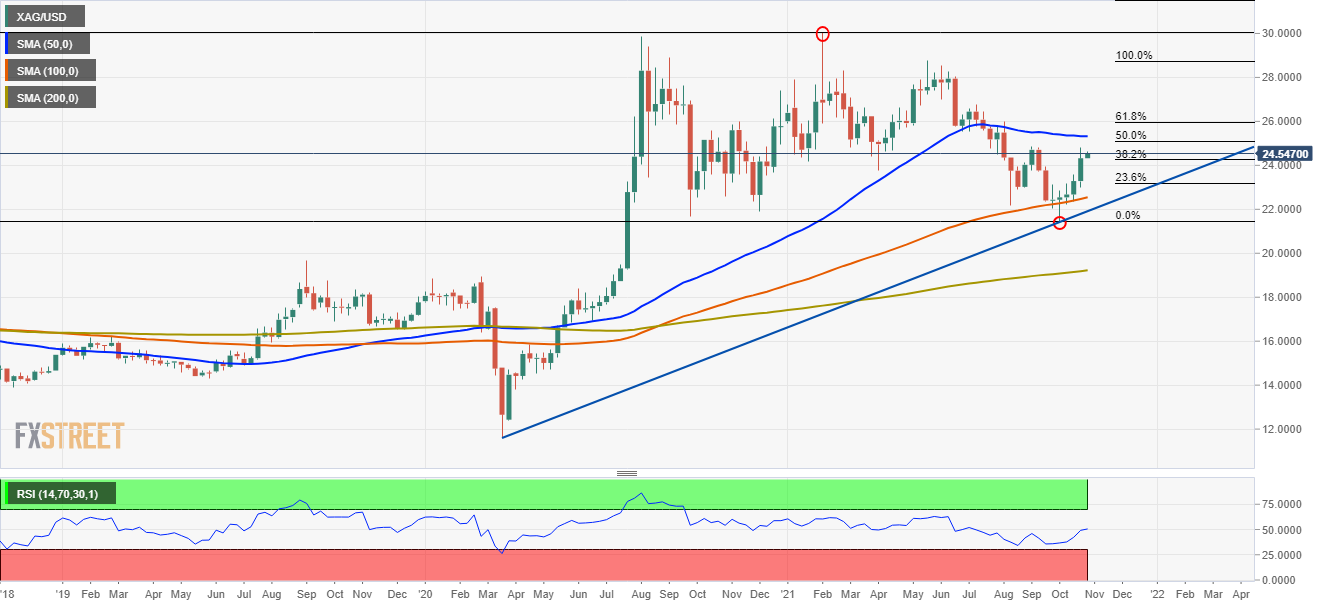
- XAG/USD: Weekly chart depicts the white metal is tilted to the upside but will face resistance at $25.00.
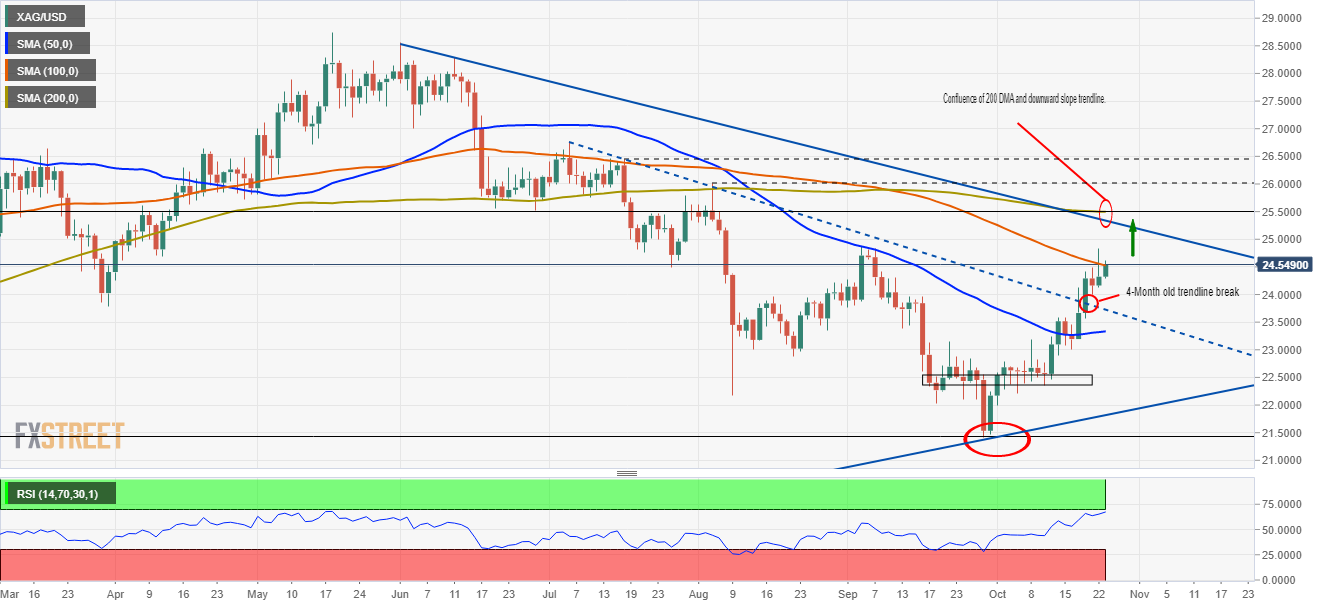
- XAG/USD: Daily chart portrays an upward trend, but RSI is aiming high near overbought levels, indicating that it could consolidate.
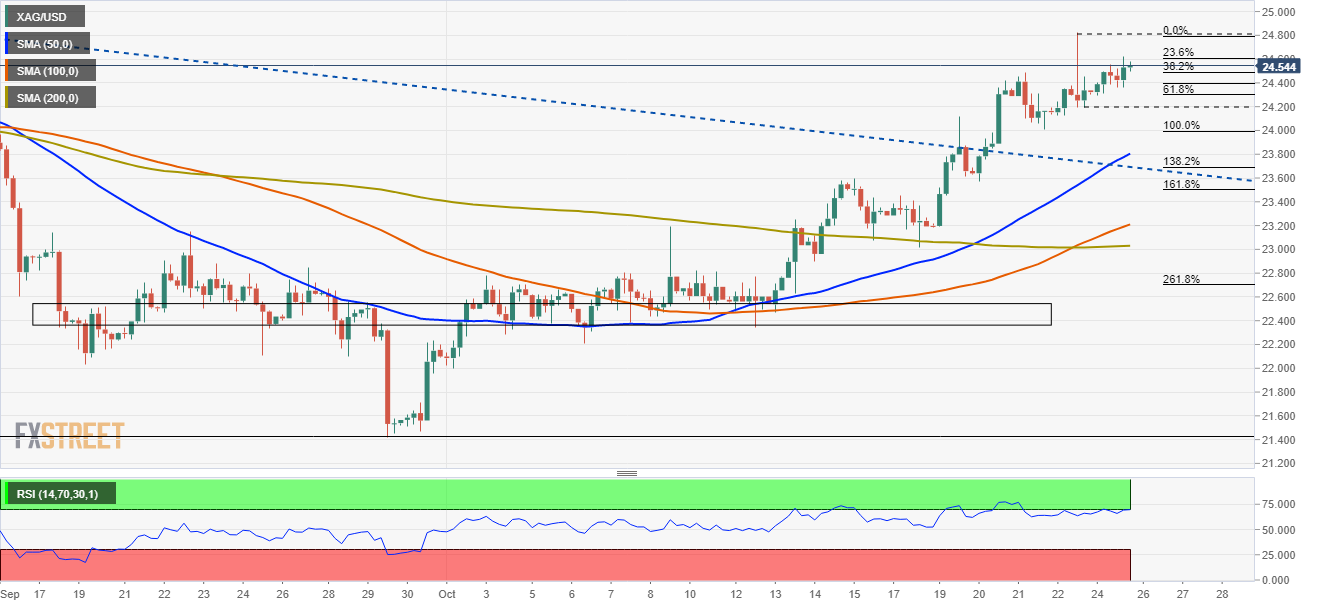
- XAG/USD: The 4-hour shows that silver upward move is overextended, as the RSI is one tick below overbought levels.
Silver (XAG/USD) begins the week in a positive tone, climbing 0.97%, trading at $24.54 during the New York session at the time of writing. The market sentiment is upbeat, portrayed by rising US stock indices, recording gains between 0.12% and 1.01%, contrarily US T-Bond yields slide, with the 10-year note rate falling one and a half basis points, sitting at 1.639%.
Meanwhile, the US Dollar Index, which price influences commodity prices, is rising 0.24%, currently at 93.83, putting a lid on silver prices, as it failed to break above $25.00 during the Monday session.
XAG/USD Price Forecast: Technical outlook
Weekly chart
The white metal is trading above the 38.2% Fibonacci retracement and the 100-week simple moving average (WSMA), near the tops of the month. Silver has an upside bias confirmed by the Relative Strenght Index (RSI), a momentum indicator is at 51, aiming higher.
Nevertheless, to continue its upward move, XAG/USD buyers will need to break above the 50% Fibonacci retracement at $25.10 to reclaim medium-term upward bias.
Daily chart
Silver follows the higher-timeframe analysis, as the daily chart depicts the white-metal is in an uptrend. The Relative Strength Index (RSI) at 67 confirms the upward bias, but it is close to overbought levels.
XAG/USD buyers will need a daily close above the 100-day moving average (DMA) at $24.52 to gain further upward strength.
In the case of that outcome, the confluence of the 200-DMA and a downward slope trendline around the $25.20-$25.50 range would be resistance for XAG/USD buyers. A breach of the latter could expose additional supply zones, like the August 4 high at $26.00, followed by the July 16 high at $26.45.
4-hour chart
Silver is in an uptrend, but it has the challenge of printing another leg-up above the $24.82 to extend the rally. The Relative Strength Index (RSI) is at 69, one tick short of reaching overbought levels, leading to a consolidation phase. Nevertheless, in case of a break above the latter, it could extend the rally towards $25.00 and beyond.
On the flip side, failure at the abovementioned level could open the door for a XAG/USD decline towards $24.20-30, as the RSI exits overbought levels before resuming the upward trend.