USD/INR Price News: 100-DMA defends Indian rupee bears
- USD/INR braces for the first weekly gain in five.
- Steady RSI, key Fibonacci retracement levels challenge sellers.
- Bulls need validation from 74.70 before eyeing the monthly resistance line.
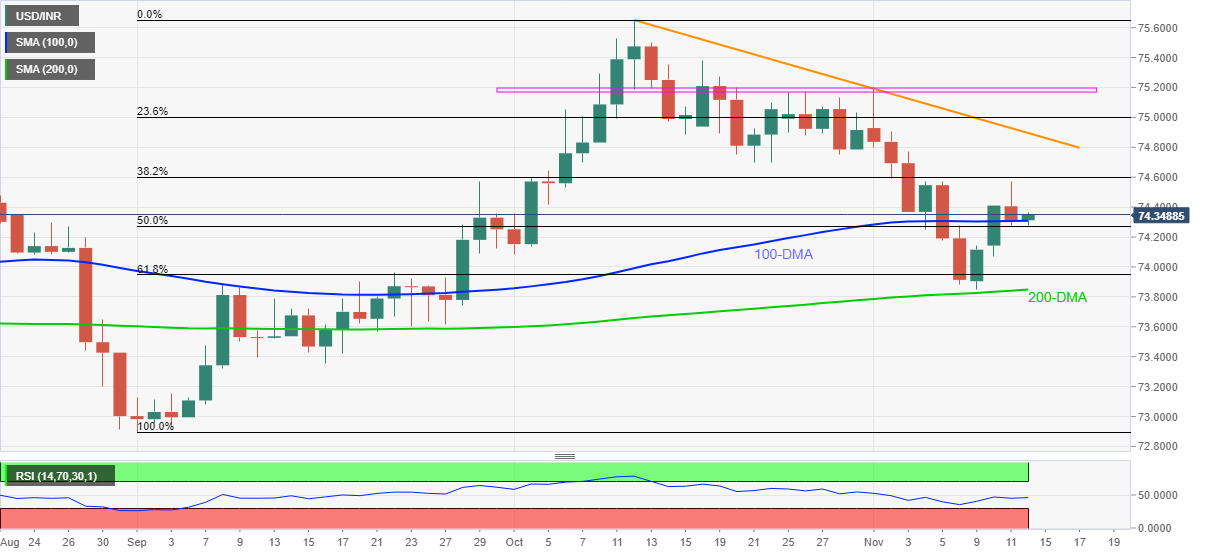
USD/INR consolidates recent losses near the weekly top of 74.57, around 74.34 heading into Friday’s European session.
In doing so, the quote remains mildly bid above 100-DMA, as well as 50% Fibonacci retracement (Fibo.) of September-October upside, amid steady RSI.
Considering the quote’s sustained trading beyond the stated DMA, also the 200-DMA and 61.8% Fibo., amid normal RSI conditions, the USD/INR prices can extend the weekly rebound towards October 21 low, near 74.70.
However, any further advances will be challenged by a one-month-old descending resistance line around 74.90 and a short-term horizontal area near 75.10.
Meanwhile, a downside break of the 100-DMA and the 50% Fibonacci retracement, close to 74.25, will direct the USD/INR towards the 74.00 threshold.
Following that, the 61.8% Fibo. and 200-DMA, respectively near 73.95 and 73.84, will challenge the pair sellers.
USD/INR: Daily chart
Trend: Further upside expected