Gold Price Forecast: XAU/USD establishes below $1,670 amid soaring hawkish Fed bets
- Gold price has slipped below the $1,661.18-1,667.78 demand zone on accelerating hawkish Fed bets.
- Long liquidation has brought a correction in the DXY.
- The US Michigan Consumer Sentiment Index is seen higher at 60 vs. 58.2 reported earlier.
Gold price (XAU/USD) is displaying a balanced profile in a narrow range of $1.661.51-1,666.76 after surrendering the critical support of $1,670.00 in the Tokyo session. The precious metal witnessed a vertical fall on Thursday after delivering a downside break of the consolidation formed in a $1,685.75-1,690.23 range. The yellow metal has refreshed its two-year low at $1,660.44 and is expected to witness more weakness amid soaring bets for a full percent rate hike by the Federal Reserve (Fed).
The Fed is bound to bring price stability to the economy even at the cost of growth prospects. As investors are aware of the fact that the headline Consumer Price Index (CPI) remained higher than expectations for August despite falling gasoline prices, the Fed is at least needed to keep the pace of hiking interest rates. As price pressures are not responding well to the current pace of rate hikes, the Fed is left with no other option than to lift interest rates by 100 basis points (bps).
Meanwhile, the US dollar index (DXY) is declining after displaying a lackluster performance, followed by a juggernaut rally. This could be the case of long liquidation as the upside bias is intact o higher consensus for US Michigan Consumer Sentiment Index. The sentiment data is seen higher at 60 vs. the prior release of 58.2.
Gold technical analysis
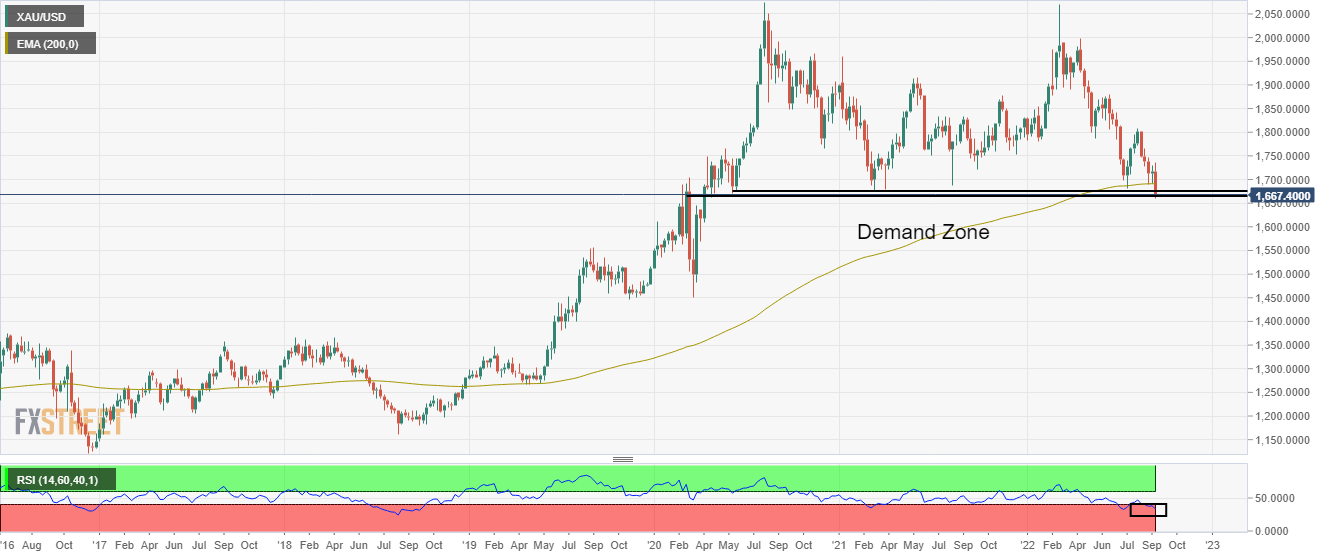
Gold price has delivered a downside break of the demand zone placed in a narrow range of $1,661.18-1,667.78 on a weekly scale. This will keep the yellow metal on the tenterhooks for a prolonged period. The precious metal has surrendered the 200-period Exponential Moving Average (EMA) at $1,692.64, which signals that the long-term trend has turned down.
Also, the Relative Strength Index (RSI) (14) has shifted inside the bearish range of 20.00-40.00, which has triggered a downside momentum.
Gold weekly chart